Updated Statistics & Customizable Trend Graphs: https://buckystats.org
The COVID-19 testing itself is very challenging to find certainty in. Given that most COVID-19 deaths have co-factors, the data on total reported deaths should be by far the most actionable. Data for more recent weeks is less complete.
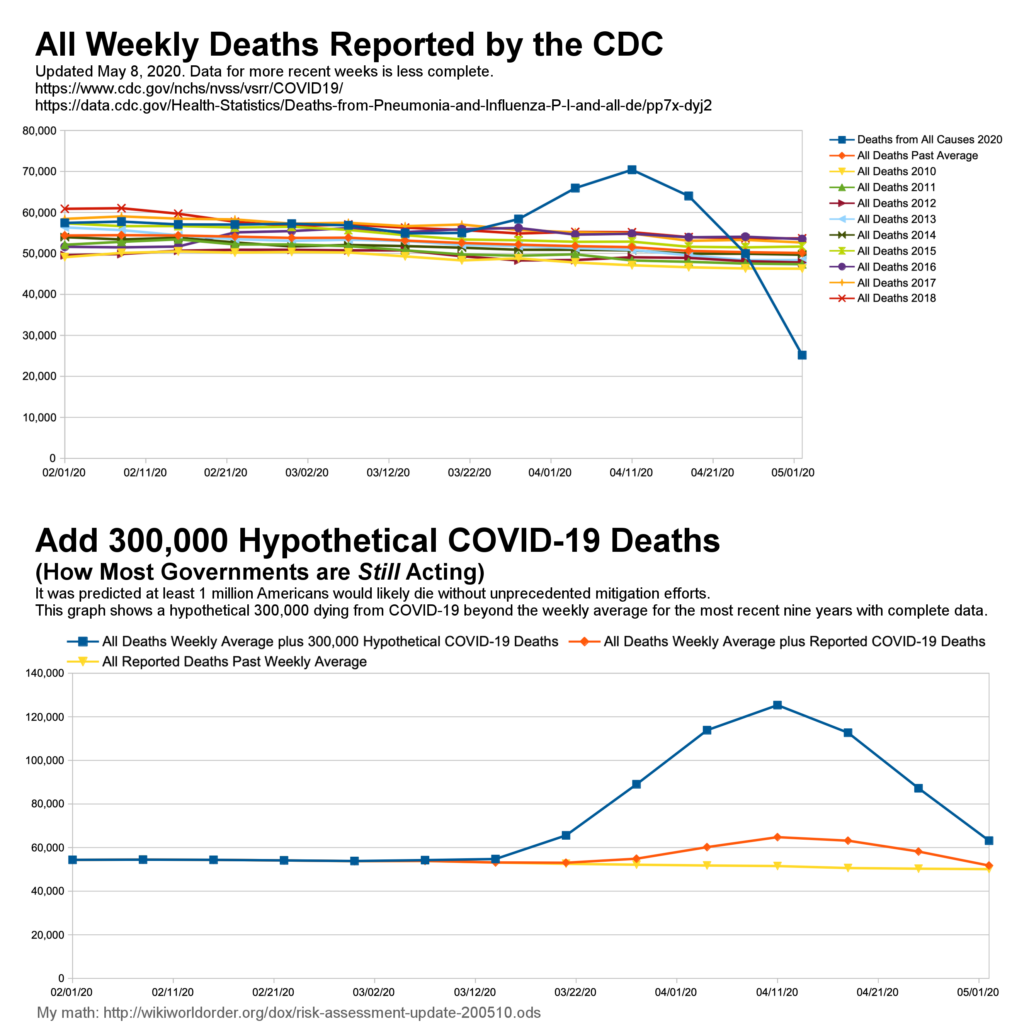
This first chart shows all weekly deaths reported by the CDC. The dark blue line going above the average represents weekly deaths from All Causes in 2020. You can see that we have exceeded the average significantly in the past month.
Sources:
https://www.cdc.gov/nchs/nvss/vsrr/COVID19/
https://data.cdc.gov/Health-Statistics/Deaths-from-Pneumonia-and-Influenza-P-I-and-all-de/pp7x-dyj2
These graphs, and my rough 300,000 simulation:
http://worldorder.wiki/dox/risk-assessment-update-200510.ods
Today on May 10, the WorldOMeters website says that 80,000 people have died from COVID-19 in the U.S. so far cumulatively. This represents about two times the average flu season. Even if I pretend that the unprecedented mitigation policies cut the cumulative deaths by half, it is very unlikely that this virus is more than four times deadlier than the seasonal flu. But when these policies were introduced, public health experts discussed this virus as being 10-15 times as bad as the seasonal flu.
It was predicted that at least 1 million Americans would likely die without unprecedented mitigation efforts. So the second graph above shows a hypothetical 300,000 dying from COVID-19 beyond the weekly averages for the most recent nine years with complete data. The dark blue line in this graph shows 300,000 deaths from COVID-19 during the same time period, compared to the orange line which shows what was observed — each stacked on top of the historical average (in yellow).
It seems most governments are still acting as if the model projections are more accurate than the observational data.
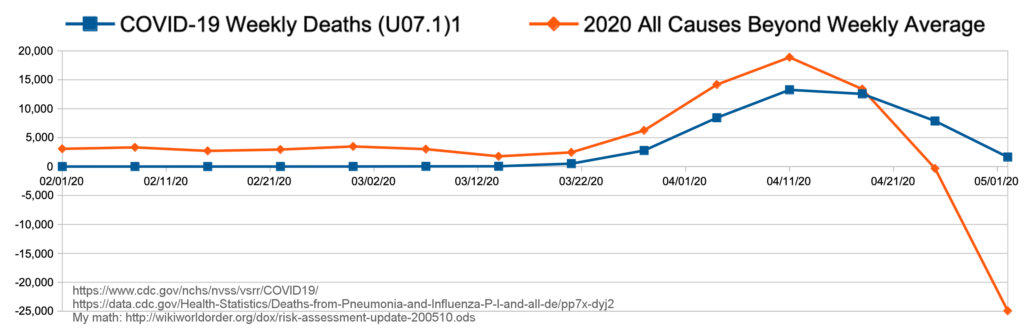
Out of curiosity, this next graph shows total (Total Weekly Deaths Reported in 2020) minus the (Historical Average for Total Weekly Deaths Reported). This measure of ‘Excess Deaths’ is placed next to reported COVID-19 Weekly Deaths for comparison:
Just some context out of other curiosity… There is an estimated 7% increase in the U.S. population from 2010-2020, with net growth in urban areas.

Source: https://www.worldometers.info/demographics/us-demographics/
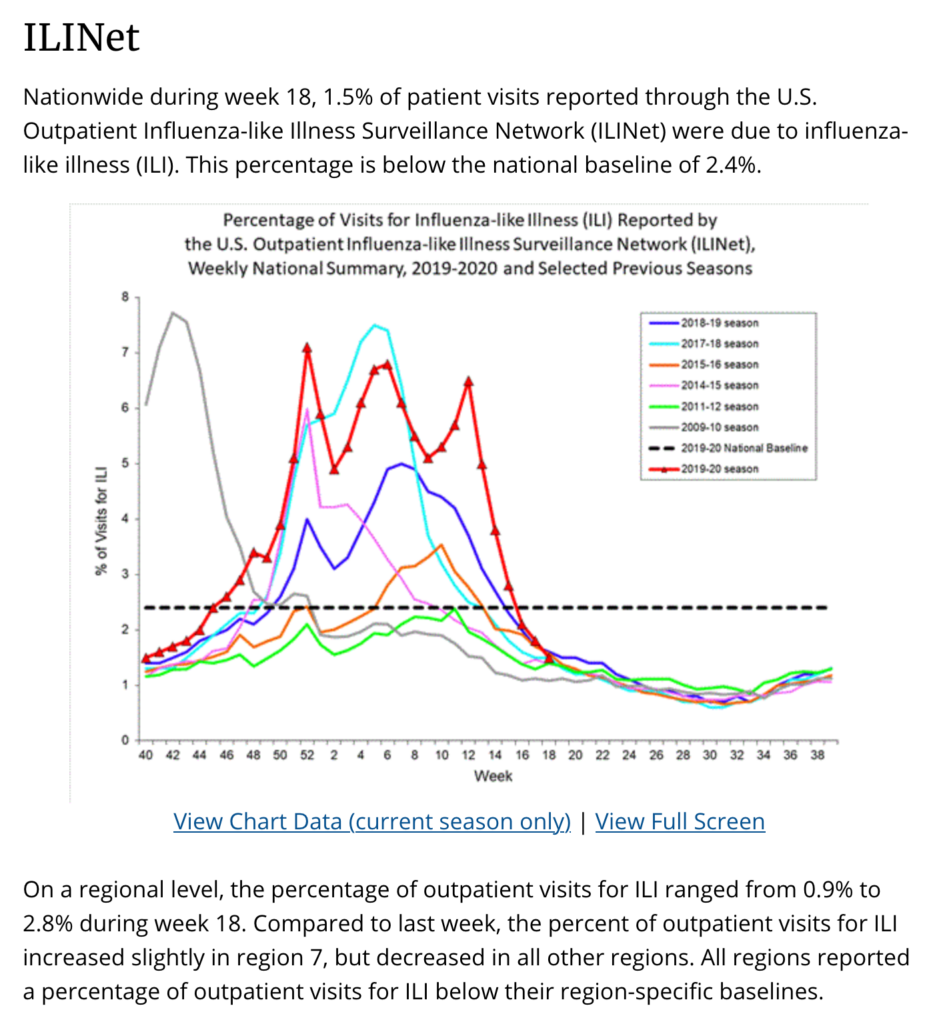
Source: https://www.cdc.gov/flu/weekly/index.htm#OISmap
Given the overlap in symptoms between COVID-19 and other season flus… It seems that if COVID-19 were as dangerous as expected, then this graph would report dramatically more activity this year.
Risks Assessment of Unprecedented Policies Enacted in Reaction
Problems caused by reactions to the original problem (virus) include a great depression. The United Nations reminds us of “the 2008 food price crisis which pushed 105 million people below the poverty line“.
This next graph is directly from the Department of Labor, a news release from May 7th on Unemployment Insurance Weekly Claims. Here we start to see the tens of millions who are losing work because of the reaction to the virus.
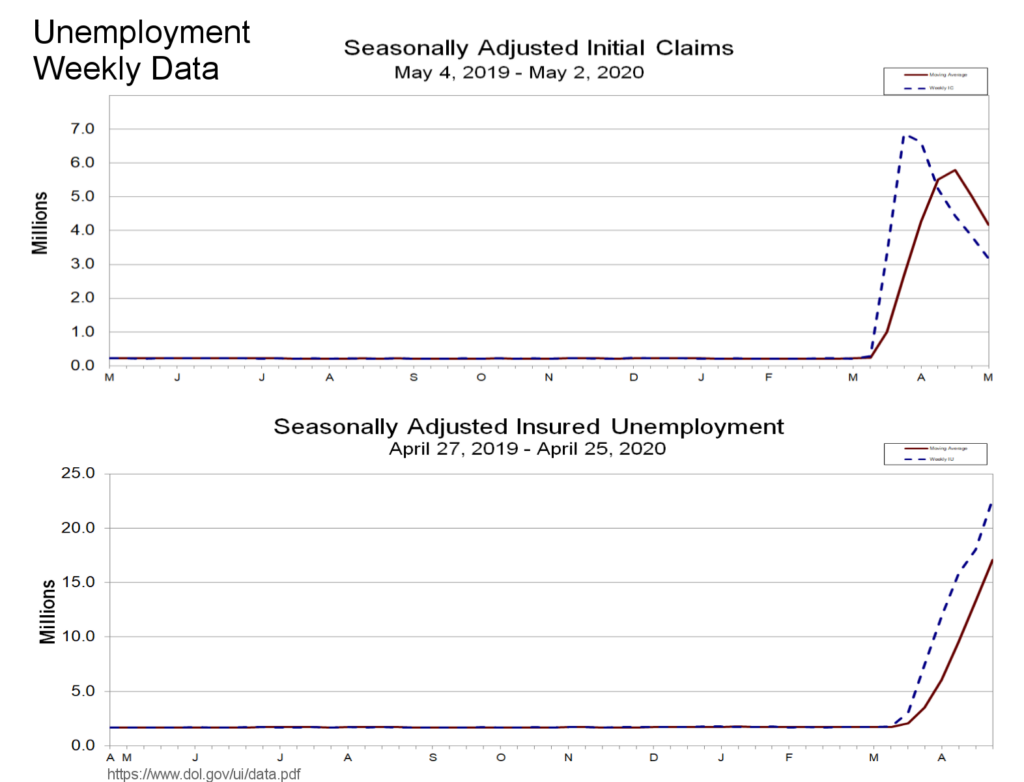
https://www.dol.gov/ui/data.pdf
I have not been able to find weekly statistics for suicides, overdoses, or deaths which could have been prevented by delayed surgeries. It will be impossible to ever measure how many people caught the disease when going to get tested (because of the panic). And how many out of all deaths have significant co-factors of extreme stress, panic, depression, or existential anxiety?
My Conclusions Based On Far More Evidence Than This:
End all states of emergency immediately. End stay at home orders. Give businesses equal opportunity to open.
Trust citizens to protect the most vulnerable.
It is unacceptable for governments to threaten the force of these policies unless a virus is at least ten times deadlier than COVID-19.
Non-linear uncertainty is not an acceptable excuse to violate any basic rights.
No More COVID-1984.
Read more of my thoughts on this topic, and evidence worth looking at, from late March:
Double-Edges of Exponential Scientism
<3
Cross-Posted:
https://medium.com/@wikiworldorder/risk-assessment-update-on-u-s-covid-19-deaths-ace741ecc3b3
https://steemit.com/science/@wikiworldorder/risk-assessment-update-on-u-s-covid-19-deaths
Updated Statistics & Customizable Trend Graphs:
