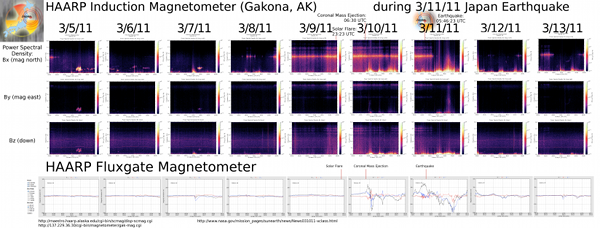
On Friday, March 11, 2011 at 05:46:23 (UTC) one of the largest earthquakes scientifically recorded struck near the east coast of Honshu, Japan. My heart and thoughts go out to ALL those who lost their lives, or lost loved ones during this devastating earthquake with nuclear side-effects from the Fukushima Dai-ichi Nuclear Power Plant…including the family of my info-warrior friend James Corbett.
This is not an accusation, just a collection and presentation of the most openly available data.
Full-quality collection of graphs: http://worldorder.wiki/images/HAARP-Japan-Earthquake.png
WordPress upgrades are making this hard…please open above link in new tab or Save As
There seem to be some fairly sound theories regarding this massive earthquake being at least partially triggered by a combination of the major March 9th X1.5-class solar flare and coronal mass ejection landing on March 10th and current Super Moon activity. So I have no degree of confidence in the theory that the use of High Frequency Active Auroral Research Program (HAARP) could have been an additional trigger for this earthquake.
But if Piers Corbyn could predict the periods of high earthquake vulnerability, surely others could too. Perhaps they could see it as an opportunity to piggy-back natural volatility and push it over the edge and/or attempt to control the exact date and/or location and/or intensity.
It is quite well documented that the HAARP system exists and is allegedly capable of many forms of weather and geophysical manipulations, including earthquakes. Since this possibility unfortunately exists, we must look to HAARP as a potential suspect for recent and future allegedly natural disasters. It is perhaps even our duty, our responsibility for the covert actions of our government. If HAARP and other risky “research” arrays (which can be used as weather weapons) were shut down, there would be far less need for entertaining this alternative analysis.
The above data was copied directly from the official HAARP website and can be verified by anyone here: http://maestro.haarp.alaska.edu/cgi-bin/scmag/disp-scmag.cgi
and here: http://137.229.36.30/cgi-bin/magnetometer/gak-mag.cgi
I have just organized all the screen shots because it is tough to look at all the data at once through the site. I have also marked on the graphic the approximate times of the earthquake, the solar flare, and the coronal mass ejection.
- The “H” component (black trace) is positive magnetic northward
- The “D” component (red trace) is positive eastward
- The “Z” component (blue trace) is positive downward
Collection of key links related to this horrific event are also being cataloged on the Wiki World Order Facebook Page here:
http://www.facebook.com/pages/Wiki-World-Order/105277679525946

