Updated Statistics & Customizable Trend Graphs: https://buckystats.org
It would be very nice if I had a lot more time — or if the professional media and health departments published regular reports with the deeper data context that I need to make potentially life-and-death decisions. But I’m finally publishing some graphs that I compiled using CDC data exports from October 21.
This round of analysis primarily involved the northeastern states in the U.S., which seemed to experience very similar first waves of excess mortality. Here, I rank various jurisdictions by their total number of COVID-related deaths.
Figure 1: COVID-Related Deaths (CDC) per Million of WHO Standard Population Distribution
This is the most statistically important graph in this post. Each state’s COVID-related deaths are broken down by age group, then scaled to a World Health Organization defined Standard Population Distribution (Table 4). This makes the data closer to useful for experts’ analysis, and provides more accurate comparisons than crude mortality numbers.

This graph includes one of the comparisons I most wanted to see. After scaling for a WHO population distribution by age group… Governor Hogan presided over 371 deaths per standardized million here in Maryland, compared to Sweden’s 203. So despite the dramatic difference in 2020 public health policies, Maryland had 85% more age-group-standardized deaths than Sweden. Sweden also experienced fewer COVID-related deaths than most of the northeastern United States… safer than 17 out of the other 24 jurisdictions in this analysis.
When I observe graphs like this, it provides compelling evidence that this year’s unprecedented policies were not a driving factor in excess mortality this year. In fact, many jurisdictions with the most aggressive policies to “slow the spread” — like my own — experienced some of the highest death rates.
Figure 2: COVID-Related Deaths (CDC) per Million of U.S. 2019 Population Distribution
Next, I thought it would be appropriate to also test scaling each jurisdiction’s data to the American population distribution estimated for 2019. I neither expected nor observed significant differences between this data standardization and the WHO population distribution above.

Figure 3: COVID-Related Deaths (CDC) as Crude Percent of Total Population
Finally, here is the simplest version of this data set, with the crude percent of deaths per total population for the same jurisdictions. This is the raw data before the standardizing-by-age provided to the graphs above. Even with crude data, Sweden experienced fewer COVID-related deaths than 15 out of the other 24 jurisdictions in this analysis.

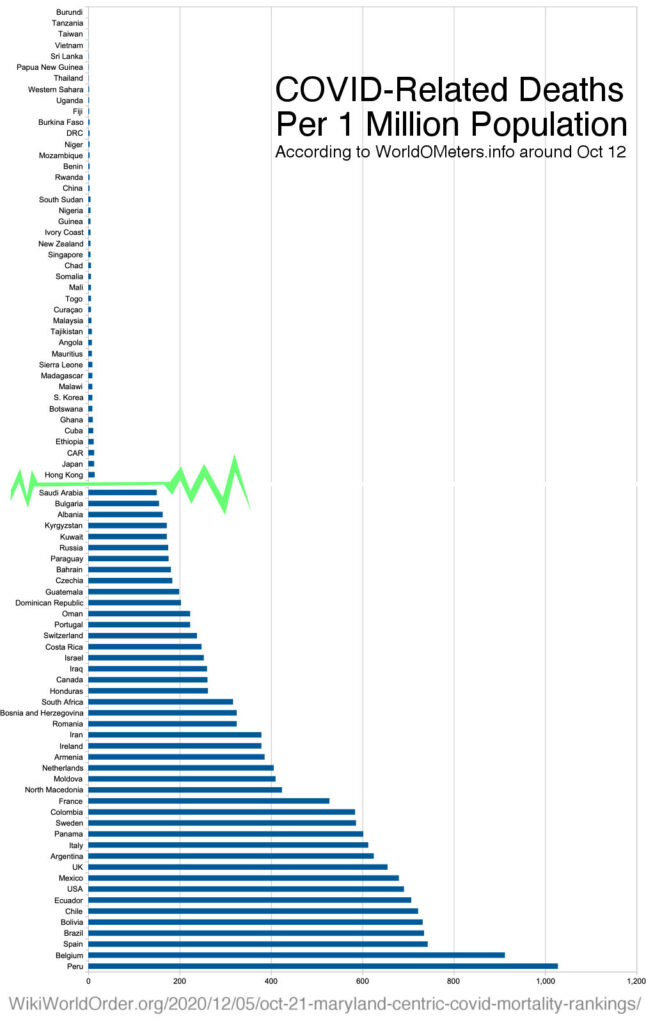
Broader Rankings Graphed Straight from WorldOMeters data around Oct 12…
Figure 4: All United States’ Rankings for COVID-Related Deaths Per 1 Million Population
Next, I’m sharing broader raw data from WorldOMeters.info, graphed around October 12. This provides crude data rankings for all of the United States jurisdictions.

Figure 5: Country Rankings for COVID-Related Deaths Per 1 Million Population
And this is more data from WorldOMeters.info, graphed around October 12. This provides crude data rankings for all of the countries around the world. The first half of this graph shows which countries reported being the absolute safest. The second half of this graph shows the most COVID-dangerous countries.
A Few More Opinions
If these graphs prove anything to me, it is that public policies were not among the most dominant factors in excess mortality during 2020. If unprecedented policies were the dominant factors, then places like Maryland should have been much safer than places like Sweden.
Based on this information, plus piles of other compelling evidence, and basic philosophical principles reducible to ‘The Golden Rule’… I still do not consent to any bio-security police state. For the previous 18 years, I’ve been trying to help efforts to roll-back the flavor of police state that we already have in “the land of the free.” So I will never support adding new laws for victimless crimes, for which there are only enough police hours to selectively enforce.

If laws are created based on extraordinary claims, then they require extraordinary evidence. After six months, I still have not received this compelling evidence I formally requested from the Office of Governor Hogan in Maryland. Tracking PBS New Hour and Democracy Now all year, I also never saw compelling evidence supporting unprecedented policies. All of my favorite “alternative media” outlets constantly provide legitimate sources of data to figure out what’s going on.
Dear Governors and ‘The Fourth Estate’,
If you want to keep working for representative instead of technocratic institutions, then please stop treating ‘we the people’ like children. In order to provide informed consent to life-and-death decisions during a novel situation, many of us require a lot more than experts pitching ‘consensus’ talking points. Most voters can handle some data. Don’t believe it? Just look at a sports page in 2019. OR, be honest with us about how you see ‘the masses’.
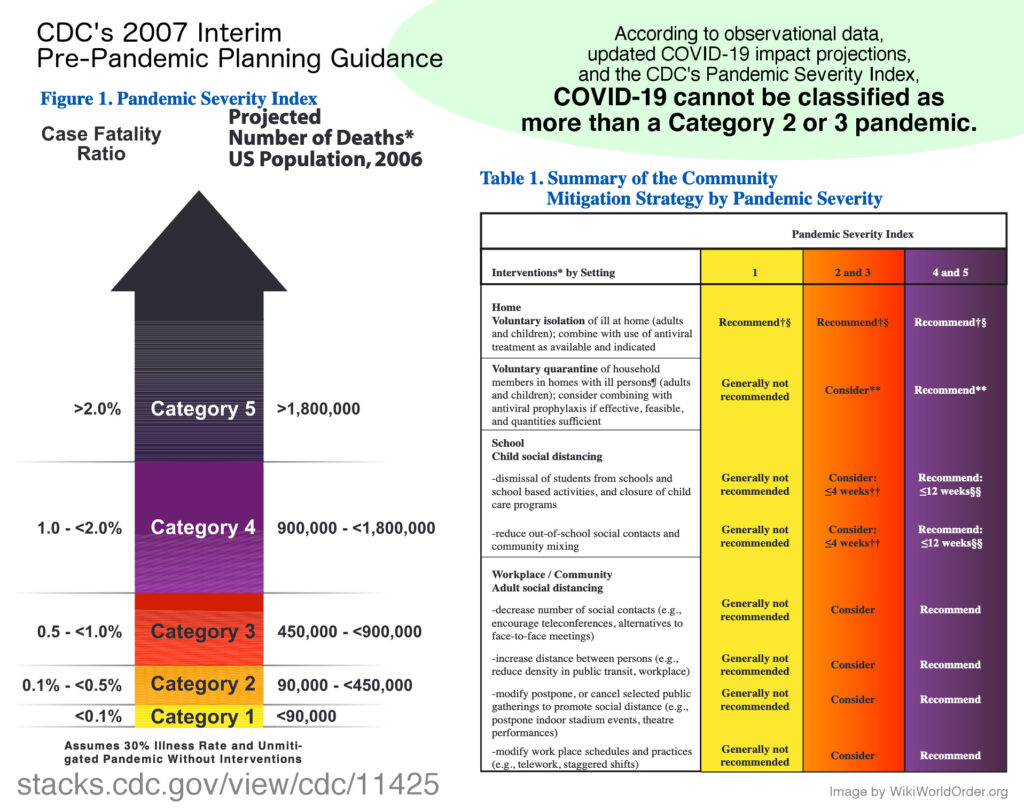
If the top-level data point predictions are not close to observations, then maybe that field of science is not ready to dominate life-and-death decisions. If such policies do not have important top-level data points that can be predicted by experts and then tracked by voters, then perhaps it has no legitimacy in driving public policy at all.
United Nations, 2005 — Universal Declaration on Bioethics and Human Rights
“2. The interests and welfare of the individual should have priority over the sole interest of science or society.
https://en.unesco.org/themes/ethics-science-and-technology/bioethics-and-human-rights
…
1. Any preventive, diagnostic and therapeutic medical intervention is only to be carried out with the prior, free and informed consent of the person concerned, based on adequate information. The consent should, where appropriate, be express and may be withdrawn by the person concerned at any time and for any reason without disadvantage or prejudice.”
Sources for Figures 1-3
Spreadsheet with data and graphs:
http://worldorder.wiki/dox/covid-rankings-october-2020.ods
CDC — Weekly Updates by Select Demographic and Geographic Characteristics
Provisional Death Counts for Coronavirus Disease 2019 (COVID-19)
Table 2. Deaths involving coronavirus disease 2019 (COVID-19), pneumonia, and influenza reported to NCHS by place of death, United States. Week ending 2/1/2020 to .*
https://www.cdc.gov/nchs/nvss/vsrr/covid_weekly/index.htm
CDC — NCHS — Weekly counts of deaths by jurisdiction and age group
https://data.cdc.gov/NCHS/Weekly-counts-of-deaths-by-jurisdiction-and-age-gr/y5bj-9g5w/
Census Bureau — ACS DEMOGRAPHIC AND HOUSING ESTIMATES
(for recent population sizes)
https://data.census.gov/cedsci/table?q=United%20States&g=0100000US&tid=ACSDP1Y2019.DP05
Statista.com — Distribution of resident population of New York in 2019, by age group
https://www.statista.com/statistics/911456/new-york-population-share-age-group/
WHO — AGE STANDARDIZATION OF RATES: A NEW WHO STANDARD
World Health Organization 2001
Table 4. WHO World Standard Population Distribution (%), based on world average population between 2000-2025
https://www.who.int/healthinfo/paper31.pdf
Statista.com — Resident population of the United States by sex and age as of July 1, 2019
(to build a U.S.-Standardized Population Distribution)
https://www.statista.com/statistics/241488/population-of-the-us-by-sex-and-age/
Statista.com — Population in Sweden from 2009 to 2019, by age group
https://www.statista.com/statistics/521717/sweden-population-by-age/
Swedish National Board of Health and Welfare — Statistics on the number of deaths in covid-19 (October 12)
On this page you will find statistics about the number of deaths in covid-19, divided into variables such as age, gender, region, comorbidity and number of deaths per day.
https://web.archive.org/web/20201017092056/https://www.socialstyrelsen.se/statistik-och-data/statistik/statistik-om-covid-19/statistik-over-antal-avlidna-i-covid-19/
Dec 15, Additional Focus:

COVID-Related Deaths (CDC as of Oct 21) per Million of WHO Standard Population Distribution
Using WHO World Standard Population Distribution (%), based on world average population between 2000-2025
These were calculated by scaling reported deaths by age groups in an attempt to compare as similarly aged populations. Before attempting to control additional mortality co-factors, the raw data suggest Maryland killed more people than leaving most public health advice voluntary.
IF you think, for example, that Maryland would have lost twice as many lives without novel public health mandates, THEN you must explain an even larger gap in the data.
More on COVID…
Governor Hogan Information Request: Followup Voicemail #1, December 4
A Few Weird Memes For 2020, December 3
October 2020 Mortality Data Update (COVID-USA), October 15
Science Denial? Rights Denial?, May 28
Drug Use and Pandemics as Public Health Issues, May 28
Governor Hogan’s Science-Based Health Policies: An Information Request Experiment, May 20
Revisiting Imperial Risk Assessments of COVID-19, May 13
Risk Assessment Update May 10 on U.S. COVID-19 Deaths, May 10
Franklin D. Roosevelt on Familiar Fascism, April 25
Clade X Quotes: The Governors’ Pandemic, April 23
Double-Edges of Exponential Scientism, March 29
Updated Statistics & Customizable Trend Graphs:
